![[symon]](img/symon.png)

syweb can apply user defined layouts to rrd data. The picture on the right shows a view that displays the statistics for my firewall over a period of 2 years. The lack of packetloss on both interfaces after a certain time clearly show the use of alternative queueing. Interesting aside: swapping ISPs from cable to ADSL -- 2Mbit vs. 768Kbit down -- halfway through february 2003 does not show up. What does clearly show is that my adding more memory and cpu power to the firewall is absolutely pointless.
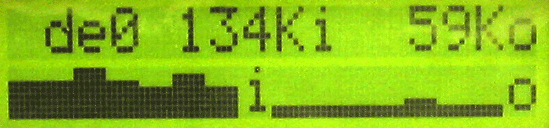
Clients seeking up to date symon measurements can connect to symux. symux will then spool these clients the data as it arrives. This picture shows sylcd -- an example client for interface statistics -- that is configured to show my firewall's activity on a Crystal fontz lcd. i/o stands for in/out, numbers are in bits per second and graphs are scaled so that the last measured maximum uses a full bar.
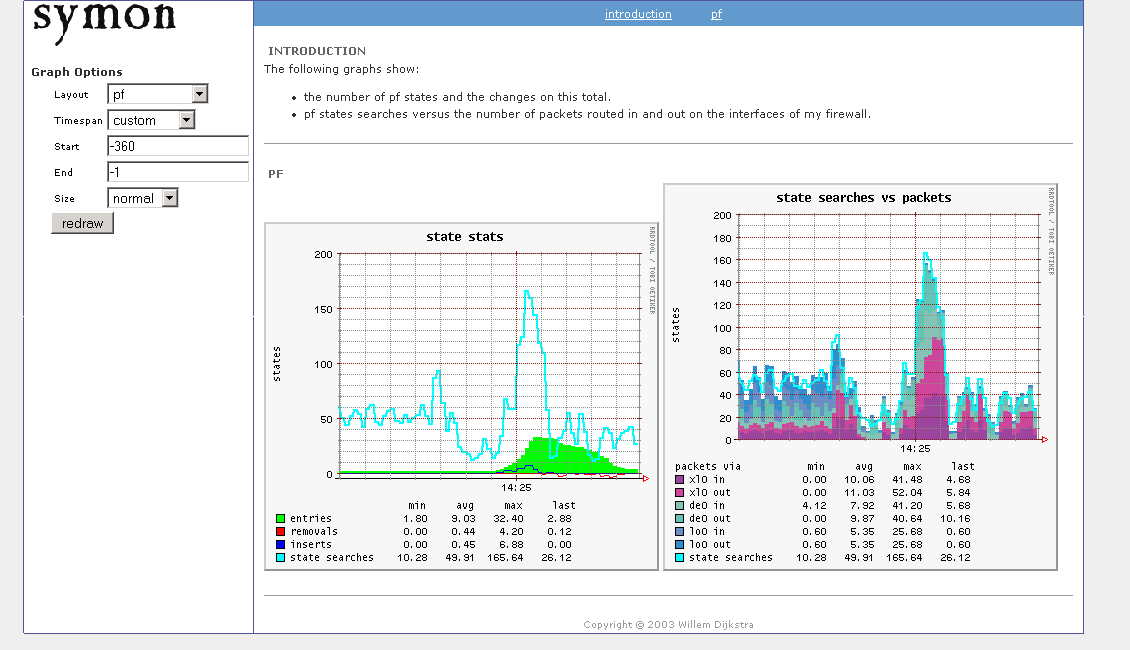
Layouts can also be used to combine a number of datasources into one picture. This one, for instance, shows how data from pf and several interfaces are combined into a single graph. The graph on the right shows how many packets were routed in or out and how many state searches there were. This snapshot was taken right after I fired up a browser and accessed a couple of newsworthy sites.
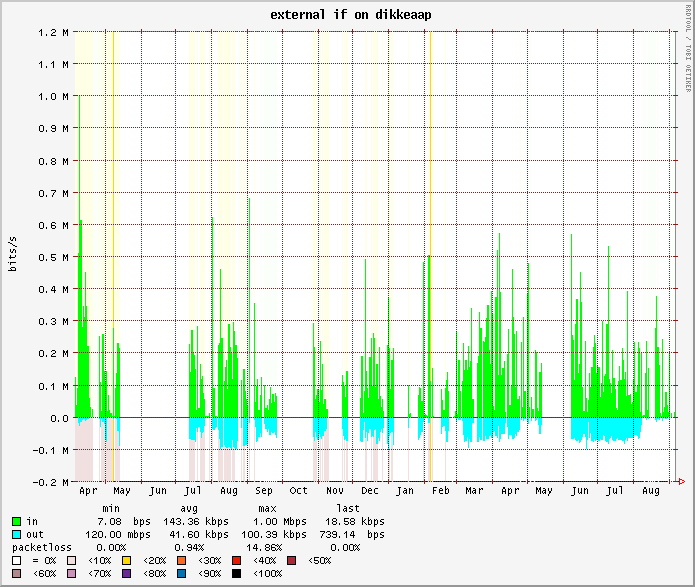
Same view as the top picture, only zoomed on the external interface graph. syweb layouts can be used to limit the control that the enduser has to over graph parameters like timespan and size. In this example only the timespan is limited.